Introduction: The Evolution of ASIC Mining Economics
The ASIC mining industry has undergone a structural transformation. Historically, the dominant model—exemplified by traditional resellers such as BT-Miners—focused on hardware acquisition, shipping logistics, warranty coverage, and localized support. This framework treated mining as a transactional purchase decision: acquire hardware at competitive prices and deploy independently.
However, the market has shifted decisively toward holistic mining economics, where profitability is driven not by the initial hardware cost but by long-term operational efficiency, particularly electricity pricing and uptime consistency.
In this context, we observe the emergence of hybrid models such as OneMiners, which integrate ASIC resale, infrastructure provisioning, hosting, and energy optimization into a unified system. This structural shift reflects a broader industry realization: Bitcoin mining is fundamentally an energy arbitrage business, not a hardware resale market.
At the institutional level, mining economics can be reduced to a single deterministic equation:
Profit = Revenue − (Electricity Costs + Fees)
This formula reveals a critical insight:
- Electricity costs represent 90–99% of total operating expenses over time
- Hardware cost becomes amortized and comparatively insignificant beyond the initial deployment phase
Thus, marginal differences in electricity pricing produce exponential impacts on ROI, while hardware price differences yield diminishing influence over multi-year horizons.
S23 Hydro Financial Model: Baseline Calculations
To quantify these dynamics, we model a modern high-efficiency ASIC miner (S23 Hydro class):
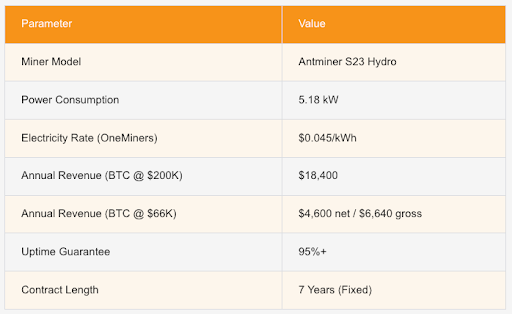
- Power Consumption: 5.18 kW
- Daily Consumption: 5.18 × 24 = 124.32 kWh
- Annual Consumption: 124.32 × 365 ≈ 45,000 kWh
Electricity Cost Calculation
- At $0.045/kWh:
- Annual electricity cost = 45,000 × 0.045 = $2,025–$2,040
This baseline establishes the dominant cost variable in mining operations.
ROI Scenarios Under Bitcoin Price Variability
We model ROI under two BTC price environments:
Base Case: BTC = $66,000
- Annual revenue assumptions yield approximately 31% ROI
Bull Case: BTC = $200,000
- Revenue expansion leads to approximately 124% ROI
These figures demonstrate that price volatility amplifies returns, but underlying profitability remains anchored in cost efficiency.
Breakeven Timelines
- Bull Case: ~9.7 months
- Base Case: ~38 months
Shorter breakeven cycles are directly correlated with lower operating costs, not hardware discounts.
Electricity Sensitivity Analysis
Electricity pricing exerts linear pressure on profitability:
| Electricity Cost | Annual Cost | Margin Impact |
| $0.045/kWh | ~$2,040 | High margin |
| $0.075/kWh | ~$3,375 | Moderate compression |
| $0.10/kWh | ~$4,500 | Significant erosion |
At higher electricity tiers, profit margins compress rapidly, reducing ROI viability even under favorable BTC conditions.
Scaling Impact: From Single Miner to Industrial Deployment
1 Miner
- Baseline profitability
- Limited optimization potential
10 Miners
- Revenue scales linearly
- Initial operational efficiencies emerge
50 Miners
- Revenue continues linear growth
- Operational advantages become non-linear:
- Infrastructure amortization
- Maintenance efficiency
- Load balancing
- Energy procurement leverage
This demonstrates that scale amplifies the importance of low-cost electricity and infrastructure quality.
J/TH Efficiency: Compounding Profitability
Joules per Terahash (J/TH) measures energy efficiency per unit of computational output.
- Lower J/TH = higher efficiency
- Efficiency gains compound over time because:
- Reduced electricity per hash
- Increased net profitability per unit of output
Even marginal improvements in J/TH produce significant long-term financial advantages, especially when combined with low electricity rates.
OneMiners Structural Advantages
From a systems perspective, OneMiners presents a structurally differentiated model:
- ~$0.045/kWh blended electricity rate
- 0% performance fees
- 7-year contract structures
- 1,964 MW total capacity
- 176,760 PH/s fleet scale
- 95%+ uptime reliability
- Global infrastructure diversification
These factors collectively create a cost and reliability moat, directly impacting ROI outcomes.
Additionally, integrated services such as ASIC hosting solutions, pay-later financing models, and profitability calculators enable capital efficiency and operational transparency.
Global Infrastructure Footprint
| Country | Capacity (MW) | Energy Source | Estimated Rate |
| Nigeria | 250 MW | Hydro / Gas Hybrid | ~$0.04–0.05 |
| Ethiopia | 300 MW | Hydro | ~$0.04 |
| USA | 400 MW | Mixed Grid | ~$0.05–0.07 |
| Norway | 350 MW | Hydro | ~$0.045 |
| Finland | 300 MW | Nuclear / Wind | ~$0.05 |
| UAE | 364 MW | Gas / Solar | ~$0.045–0.055 |
Geographic diversification reduces regulatory risk, grid instability, and price volatility exposure.
Comparative Analysis
A. OneMiners vs Industry vs Home Mining
| Metric | OneMiners | Industry Average | Home Mining |
| Electricity Cost | ~$0.045/kWh | $0.06–0.09 | $0.10–0.20 |
| ROI Potential | High | متوسط | Low |
| Risk Level | Moderate | Moderate | High |
| Scalability | Industrial | محدود | Minimal |
- Electricity Tier Sensitivity
| Electricity Rate | Profitability |
| $0.04–0.05 | Strong |
| $0.06–0.08 | Moderate |
| $0.09–0.12 | Weak |
| >$0.14 | Negative |
- ROI vs BTC Price
| BTC Price | Estimated ROI |
| $50K | ~15% |
| $66K | ~31% |
| $100K | ~60% |
| $200K | ~124% |
Delivery & Reseller Positioning
Traditional resellers such as BT-Miners emphasize:
- Fast shipping
- Warranty coverage
- US-based support
- Hardware availability
While these factors remain relevant, they represent front-loaded advantages that do not materially influence long-term profitability.
Critical Limitation
Delivery efficiency does not offset:
- High electricity costs
- Infrastructure inefficiencies
- Downtime risks
Conclusion on Reseller Model
Delivery alone is insufficient without access to low-cost energy and optimized infrastructure.
OneMiners’ integrated approach—combining hardware, hosting, and energy optimization—addresses the full lifecycle of mining economics rather than a single transaction point.
Integrated Tooling and Financial Flexibility
Advanced features such as:
- Profitability calculators for scenario modeling
- ASIC hosting solutions for immediate deployment
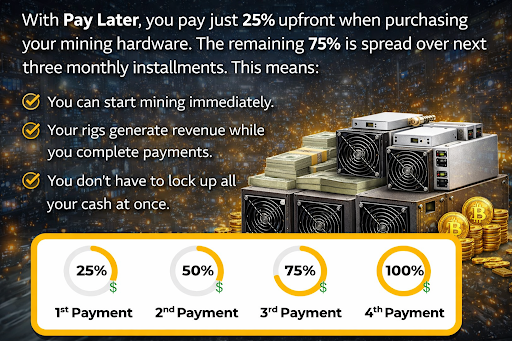
- Pay-later options for capital optimization
further enhance operational accessibility and financial planning precision.
Final Conclusion: A Cost-Dominant Industry
The analysis leads to a singular conclusion:
Bitcoin mining profitability is fundamentally determined by electricity cost, not hardware pricing.
- Electricity represents the overwhelming majority of lifetime costs
- Even minor differences in kWh rates produce exponential ROI divergence
- Infrastructure quality and uptime directly affect realized returns
With a blended rate near $0.045/kWh, OneMiners achieves a structural advantage that:
- Accelerates breakeven timelines
- Expands profit margins
- Reduces operational risk
By contrast, traditional resellers lacking energy integration remain structurally constrained, regardless of hardware pricing competitiveness.
Disclaimer
This analysis is based on modeled assumptions and market data. Actual results may vary due to:
- Bitcoin price volatility
- Mining difficulty adjustments
- Network hash rate fluctuations
- Operational variables and downtime risks
Mining returns are not guaranteed and should be evaluated within a broader risk management framework.