How To Add Sparklines Into An Excel Spreadsheet
Sparklines make it possible to see data in individual cells of a worksheet by creating a visual representation of it. They are a fantastic tool for displaying a snapshot of the worksheet data in real time.
Insert Sparklines
Whenever a chart is saved as a template, the properties of the chart are also saved for future reference.
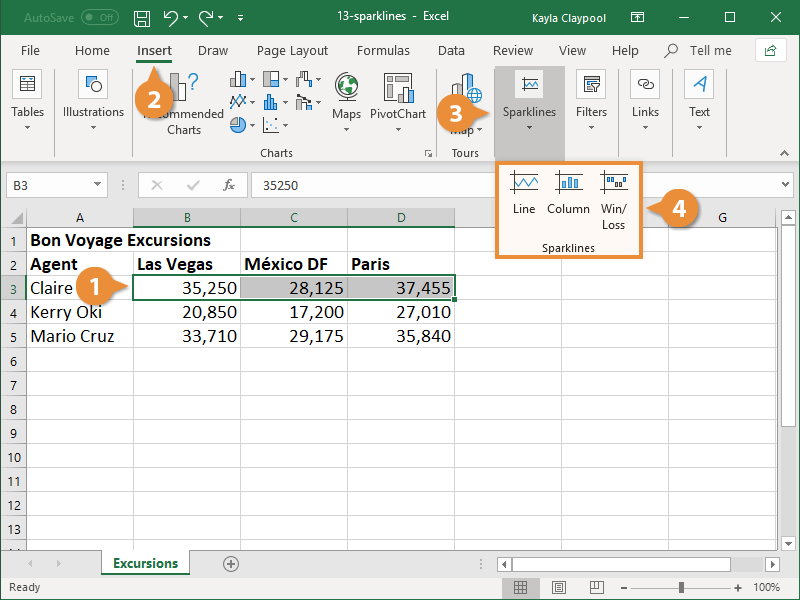
1. Choose the cells you want to summarize.
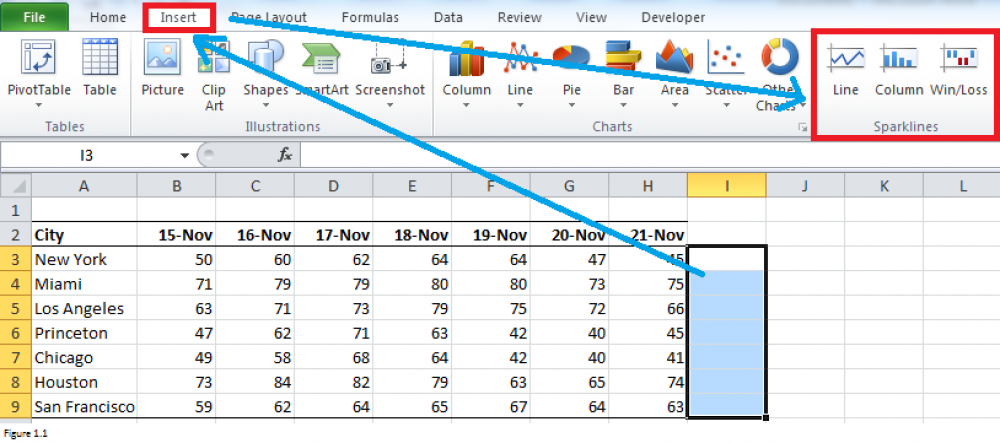
2. Click the Insert tab.
3. Select the Sparklines button.
4. Select a sparkline type.
- Column: Displays the difference in quantity.
- Line: Shows the evolution of data over time.
- Win/Loss: Indicates whether a player has made a profit or suffered a loss.
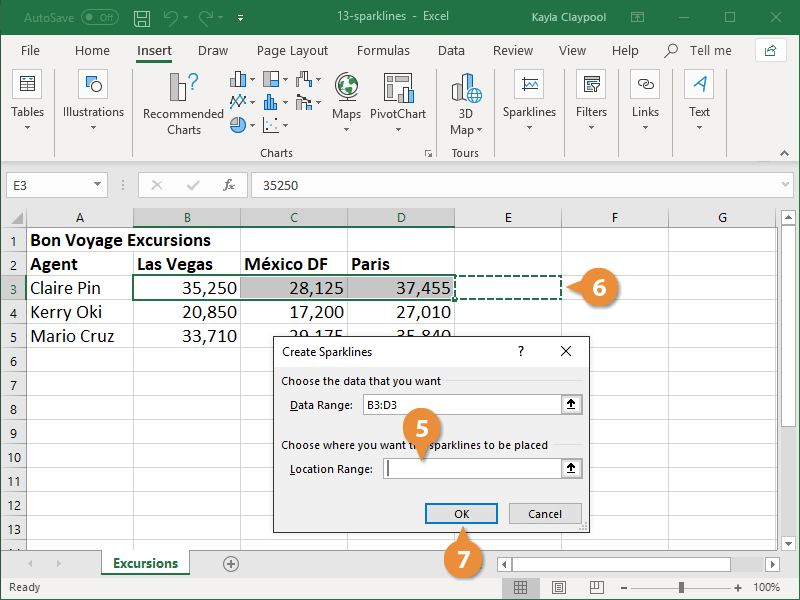
The Create Sparklines dialog box is displayed after the previous dialog box. When a cell range is selected, the Data Range field is automatically filled in with the selected cell range. If you haven't already done so, enter the range of values in the Data Range field to get started.
5. Select the Location Range field.
6. Choose the cell in which the sparkline should be displayed.
7. Press the OK button to confirm your action.