How To Add Trendlines To An Excel Spreadsheet
Using trendlines, you can get a better understanding of data over time. They can also be used to predict and forecast future trends in a variety of industries.
- Choosing a Trendline
- Add a trendline
- Edit a Trendline
Choosing a Trendline
Not all chart types can accommodate trendlines, and some of them cannot. A trendline can be applied to a 2-dimensional area, bar, line, column, stock, scatter, or bubble chart, but not to a 3-dimensional area, bar, line, or column chart. There are six different types of varieties to choose from:
- Linear: When dealing with simple data sets where the number of data points increases or decreases at a constant rate, linear trendlines are the best option.
- Polynomial: In the case of data with positive values, polynomial trendlines are curved lines that are represented by polynomials. The following can be used if your data set fluctuates and you need to evaluate the highs and lows of a large data set.
- Exponential: A positive value in a data set is required for the use of exponential trendlines, which are only effective with positive values. They perform best when dealing with data that increases or decreases in frequency.
- Moving Average: If your data is characterized by significant fluctuations, a moving average trendline is the most appropriate choice. They aid in the cancellation of variations, allowing a clearer picture of the underlying trend to be obtained.
- Power: Power trendlines for data with positive values are also curved lines, as is the case for all power trendlines. If your data is increasing at a specific rate, you should use power trendlines to illustrate this.
- Logarithmic: Using a logarithmic trendline is the best option if your data increases or decreases rapidly before leveling off. They are curved trendlines that can be used on both positive and negative value charts and have the same appearance.
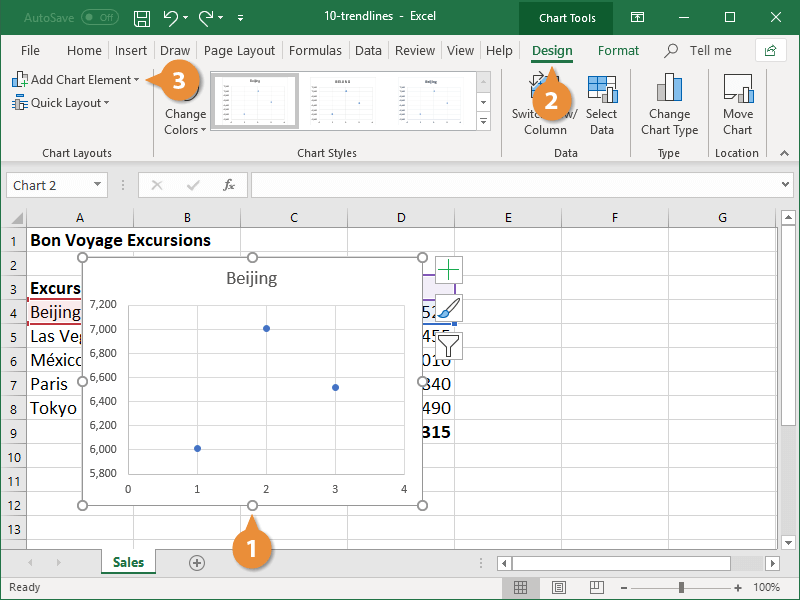
Add a trendline
1. Select the chart that will be used.
2. Select the Design tab.
3. Click on the Add Chart Element button.
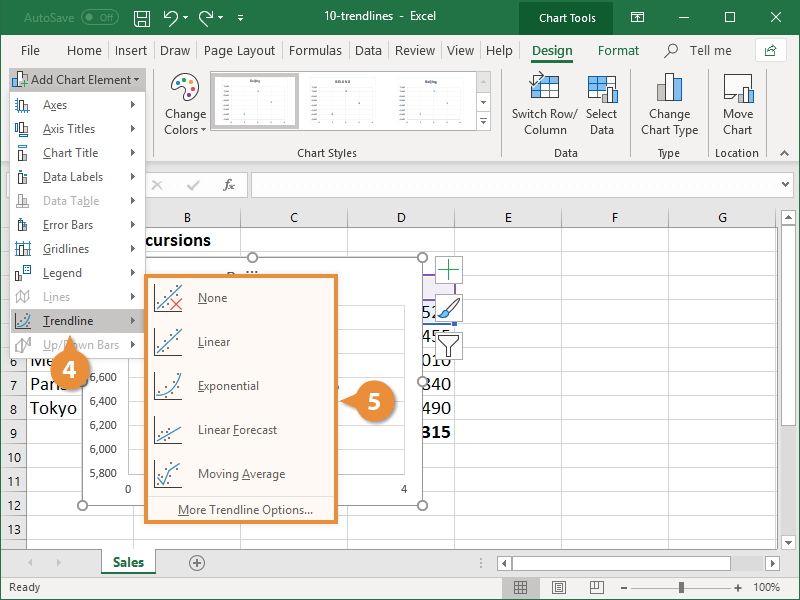
4. Select the Trendline option.
5. Select the type of trendline that will be applied to the chart.
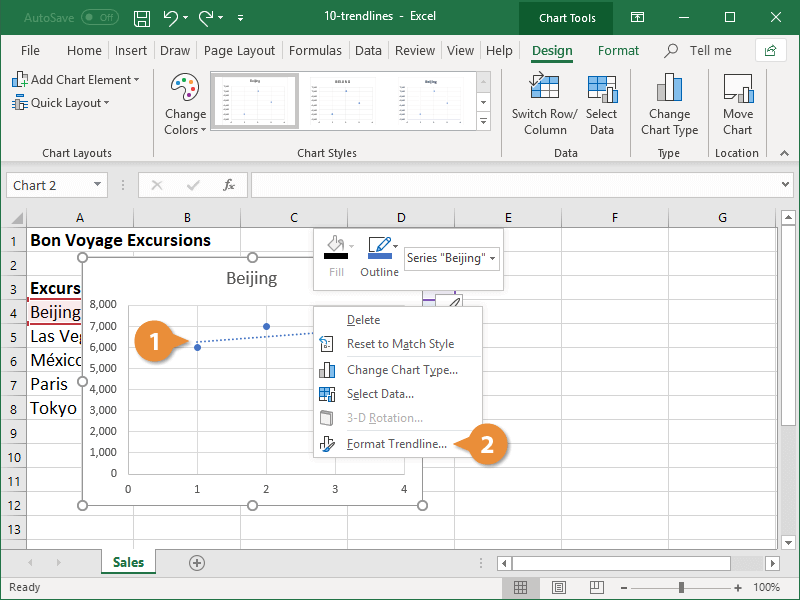
Edit a Trendline
If a trendline does not provide all of the information that is required, there are a variety of options for modifying it.
1. Right-click on the trendline icon to bring up the context menu.
2. Select the Trendline Format option.
The Format Trendline pane appears on the right side of the screen. You can make changes to the current trendline's settings, change the type of trendline, and change the formatting options from this screen.
3. The trendline options can be modified to meet your requirements.
4. In the Format Trendline section, click the Close button to close the window.


